Normal Distribution
In probability theory, the normal (or Gaussian) distribution is a continuous probability distribution, defined on the entire real line, that has a bell-shaped probability density function, known as the Gaussian function or informally as the bell curve:
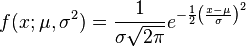
The parameter μ is the mean or expectation (location of the peak) and σ 2 is the variance. σ is known as the standard deviation. The distribution with μ = 0 and σ 2 = 1 is called the standard normal distribution or the unit normal distribution. A normal distribution is often used as a first approximation to describe real-valued random variables that cluster around a single mean value.
The normal distribution is considered the most prominent probability distribution in statistics. There are several reasons for this: First, the normal distribution arises from the central limit theorem, which states that under mild conditions, the mean of a large number of random variables independently drawn from the same distribution is distributed approximately normally, irrespective of the form of the original distribution. This gives it exceptionally wide application in, for example, sampling. Secondly, the normal distribution is very tractable analytically, that is, a large number of results involving this distribution can be derived in explicit form.
For these reasons, the normal distribution is commonly encountered in practice, and is used throughout statistics, the natural sciences, and the social sciences as a simple model for complex phenomena. For example, the observational error in an experiment is usually assumed to follow a normal distribution, and the propagation of uncertainty is computed using this assumption. Note that a normally distributed variable has a symmetric distribution about its mean. Quantities that grow exponentially, such as prices, incomes or populations, are often skewed to the right, and hence may be better described by other distributions, such as the log-normal distribution or the Pareto distribution. In addition, the probability of seeing a normally distributed value that is far (i.e. more than a few standard deviations) from the mean drops off extremely rapidly. As a result, statistical inference using a normal distribution is not robust to the presence of outliers (data that are unexpectedly far from the mean, due to exceptional circumstances, observational error, etc.). When outliers are expected, data may be better described using a heavy-tailed distribution such as the Student's t-distribution.
From a technical perspective, alternative characterizations are possible, for example:
- The normal distribution is the only absolutely continuous distribution all of whose cumulants beyond the first two (i.e. other than the mean and variance) are zero.
- For a given mean and variance, the corresponding normal distribution is the continuous distribution with the maximum entropy.
The normal distributions are a subclass of the elliptical distributions.
Read more about Normal Distribution: Definition, Characterization, Normality Tests, Estimation of Parameters, Bayesian Analysis of The Normal Distribution, Occurrence, Generating Values From Normal Distribution, Numerical Approximations For The Normal CDF
Famous quotes containing the words normal and/or distribution:
“Freedom is poetry, taking liberties with words, breaking the rules of normal speech, violating common sense. Freedom is violence.”
—Norman O. Brown (b. 1913)
“The man who pretends that the distribution of income in this country reflects the distribution of ability or character is an ignoramus. The man who says that it could by any possible political device be made to do so is an unpractical visionary. But the man who says that it ought to do so is something worse than an ignoramous and more disastrous than a visionary: he is, in the profoundest Scriptural sense of the word, a fool.”
—George Bernard Shaw (1856–1950)