Genomic Control
The assumption of population homogeneity in association studies, especially case-control studies, can easily be violated and can lead to both type I and type II errors. It is therefore important for the models used in the study to compensate for the population structure. The problem in case control studies is that if there is a genetic involvement in the disease, the case population is more likely to be related than the individuals in the control population. This means that the assumption of independence of observations is violated. Often this will lead to an overestimation of the significance of an association but it depends on the way the sample was chosen. As long as there is a higher allele frequency in a subpopulation you will find association with any trait more prevalent in the case population. This kind of spurious association increases as the sample population grows so the problem should be of special concern in large scale association studies when loci only cause relatively small effects on the trait. A method that in some cases can compensate for the above described problems has been developed by Devlin and Roeder (1999). It uses both a frequentist and a Bayesian approach (the latter being appropriate when dealing with a large number of candidate genes). Here is a short description of how the frequentist way of correcting for population stratification works. It works by using markers that are not linked with the trait in question to correct for any inflation of the statistic caused by population stratification. The method was first developed for binary traits but has since been generalized for quantitative ones . For the binary one, which applies to finding genetic differences between the case and control populations, Devlin and Roeder (1999) use Armitage's trend test

and the test for allelic frequencies
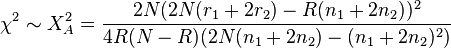
| Alleles | aa | Aa | AA | total |
|---|---|---|---|---|
| Case | r0 | r1 | r2 | R |
| Control | s0 | s1 | s2 | S |
| total | n0 | n1 | n2 | N |
If the population is in Hardy-Weinberg equilibrium the two statistics are approximately equal. Under the null hypothesis of no population stratification the trend test is asymptotic distribution with one degree of freedom. The idea is that the statistic is inflated by a factor so that where depends on the effect of stratification. The above method rests upon the assumption that the inflation factor is constant, which means that the loci should have roughly equal mutation rates, should not be under different selection in the two populations, and the amount of Hardy-Weinberg disequilibrium measured in Wright’s coefficient of inbreeding F should not differ between the different loci. The latter being of greatest concern. If the effect of the stratification is similar across the different loci can be estimated from the unlinked markers  where L is the number of unlinked markers. The denominator is derived from the gamma distribution as a robust estimator of . Other estimators have been suggested, for example, suggested using the mean of the statistics instead. This is not the only way to estimate but according to it is an appropriate estimate even if some of the unlinked markers are actually in disequilibrium with a disease causing locus or are themselves associated with the disease. Under the null hypothesis and when correcting for stratification using L unlinked genes, is approximately distributed. With this correction the overall type I error rate should be approximately equal to even when the population is stratified. Devlin and Roeder (1999) mostly considered the situation where gives a 95% confidence level and not smaller p-values. Marchini et al. (2004) demonstrates by simulation that genomic control can lead to an anti-conservative p-value if this value is very small and the two populations (case and control) are extremely distinct. This was especially a problem if the number of unlinked markers were in the order 50 − 100. This can result in false positives (at that significance level).
Read more about this topic: Population Stratification
Famous quotes containing the word control:
“We long for our father. We wear his clothes, and actually try to fill his shoes. . . . We hang on to him, begging him to teach us how to do whatever is masculine, to throw balls or be in the woods or go see where he works. . . . We want our fathers to protect us from coming too completely under the control of our mothers. . . . We want to be seen with Dad, hanging out with men and doing men things.”
—Frank Pittman (20th century)