Pearson's Product-moment Coefficient
The most familiar measure of dependence between two quantities is the Pearson product-moment correlation coefficient, or "Pearson's correlation." It is obtained by dividing the covariance of the two variables by the product of their standard deviations. Karl Pearson developed the coefficient from a similar but slightly different idea by Francis Galton.
The population correlation coefficient ρX,Y between two random variables X and Y with expected values μX and μY and standard deviations σX and σY is defined as:
where E is the expected value operator, cov means covariance, and, corr a widely used alternative notation for Pearson's correlation.
The Pearson correlation is defined only if both of the standard deviations are finite and both of them are nonzero. It is a corollary of the Cauchy–Schwarz inequality that the correlation cannot exceed 1 in absolute value. The correlation coefficient is symmetric: corr(X,Y) = corr(Y,X).
The Pearson correlation is +1 in the case of a perfect positive (increasing) linear relationship (correlation), −1 in the case of a perfect decreasing (negative) linear relationship (anticorrelation), and some value between −1 and 1 in all other cases, indicating the degree of linear dependence between the variables. As it approaches zero there is less of a relationship (closer to uncorrelated). The closer the coefficient is to either −1 or 1, the stronger the correlation between the variables.
If the variables are independent, Pearson's correlation coefficient is 0, but the converse is not true because the correlation coefficient detects only linear dependencies between two variables. For example, suppose the random variable X is symmetrically distributed about zero, and Y = X2. Then Y is completely determined by X, so that X and Y are perfectly dependent, but their correlation is zero; they are uncorrelated. However, in the special case when X and Y are jointly normal, uncorrelatedness is equivalent to independence.
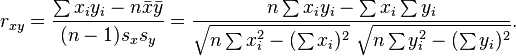
If we have a series of n measurements of X and Y written as xi and yi where i = 1, 2, ..., n, then the sample correlation coefficient can be used to estimate the population Pearson correlation r between X and Y. The sample correlation coefficient is written

where x and y are the sample means of X and Y, and sx and sy are the sample standard deviations of X and Y.
This can also be written as:
If x and y are results of measurements that contain measurement error, the realistic limits on the correlation coefficient are not −1 to +1 but a smaller range.
Read more about this topic: Correlation And Dependence
Famous quotes containing the word pearson:
“The newly-formed clothing unions are ready to welcome her; but woman shrinks back from organization, Heaven knows why! It is perhaps because in organization one find the truest freedom, and woman has been a slave too long to know what freedom means.”
—Katharine Pearson Woods (1853–1923)